The main window consists of 3 primary components. Menu/toolbar, editors and views. The default arrangement of the interface places the Navigator view on the left, editors in the middle and other views at the bottom, as show in the screenshot.
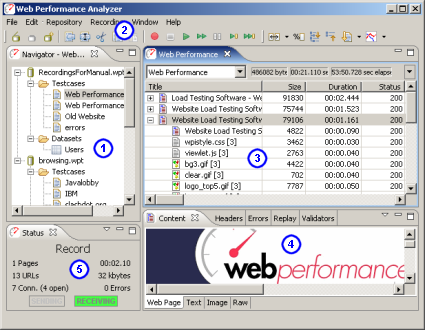
The Navigator shows the contents of each open repository. Double-click repository items (or select a testcase and choose Edit from the pop-up menu) to open it in an editor.
Note: Every open repository loads the contents of each test cases into memory. Closing unused repositories will reduce the memory consumed by the test cases.

The toolbars provide shortcuts to the most common operations in the Navigator and Editor.
The Testcase Editor displays the recorded testcase as a tree of pages and URLs. The testcase can be sorted by the size and duration columns to quickly find the slowest pages and URLs in the testcase. An icon at the beginning of each row differentiates web pages from text files, images, forwards and errors. Secure transactions (SSL) are indicated by a lock icon at the beginning of the URL column. The editor can also display the performance differences between two replays of a testcase.
The Dataset Editor displays and edits the data and settings for a Dataset.
The Performance Trend chart shows the changes in page size and duration over multiple replays of a testcase. It is opened from either the Navigator pop-up menu or the drop-down menu in the editor.
The Status View displays the status of long-running operations, such as recording, replaying testcases and opening repositories.
Editors vs. Views
Editors (including reports) are always located in the center of the Load Tester window. Views can be arranged around the edges of the Load Tester window. Once the size of a view has been set, it will try to maintain that size as the Load Tester window is resized. The editors will receive whatever space is left over.
Resizing
Any of the panes in the Load Tester window can be resized and the new sizes will be remembered when you restart Load Tester.
Rearranging
Any view can be reordered within the tab group or moved to other place in the window by dragging the tab for that view. The entire tab group can be moved using the Move->Tab Group menu item from the tab's pop-up menu.
Detaching floating windows
Any view can be detached to a separate floating window using the Detached menu item from the tab's pop-up menu. Editors cannot be detached.
Each editor and view can be minimized or maximized within the Load Tester window using the minimize/maximize buttons at the top right corner of each view. The editors and views can also be minimized and maximized by double-clicking the tab for the editor/view.
Viewing multiple editors
By default all editors appear in the same area of the Load Tester window. To view multiple editors side-by-side, drag the tab for the editor towards the desired edge. Restore the arrangement by dragging one editor tab onto another editor.