The purpose of this tutorial is to illustrate the steps required to load-test a web service using Web Performance Load Tester. Although the demonstration service used in this tutorial is very simple, the concepts presented are directly applicable to more complicated services.
This tutorial is organized into 4 main steps:
The service tested in this tutorial provides an interface to bank accounts. A similar service might be used, for example, to allow ATM machines in bank branches to access accounts in the central bank system. The operations used in this tutorial are login and get-balance. These operations use a simple pseudo-XML format for ease of readability.
The login transaction sends the username and password in a login operation. If successful, the response contains a session identifier that must be used for future transactions. The XML sent and received in this transaction look like this:
![]()
|
|
|
|
The get-balance transaction sends the session identifier and, if successful, receives the account balance (in cents). The pseudo-XML sent and received in this transaction look like this:
![]()
In two example transactions show above, user "JAMES" logs into the system using the password "nkbmmfn". The result value "1" in the response indicates a successful login and provides a session identifier to be used in future transactions. He then checks his balance and finds that he has $7.49 in his account (749 cents).
The first step in the load-testing process is to create the testcase to be simulated. The testcase is a collection of HTTP transactions (requests and responses). When testing a browser-based application, this step is usually achieved by using the browser to interact with the website in the same manner any user would - with the browser configured to use a recording proxy. This proxy records the HTTP transactions between the browser (client) and server and creates the testcase using these transactions. If you have a client for your web service and it supports the use of a proxy, this is the fastest way to get a testcase created.
Since many web services do not have this ability, we will demonstrate how to create the transactions from scratch.
The first step is to create the content of the request - that is the pseudo-XML shown above. Paste this into your favorite plain-text editor and then save the file (e.g. login-request.txt). Next, note the length of the file - this length will be needed when we add the HTTP headers.
Step 2 involves putting the HTTP start-line and headers into the request. Below on the left are the start-line and headers used for this example request - the required headers may be different depending on the requirements of your service.
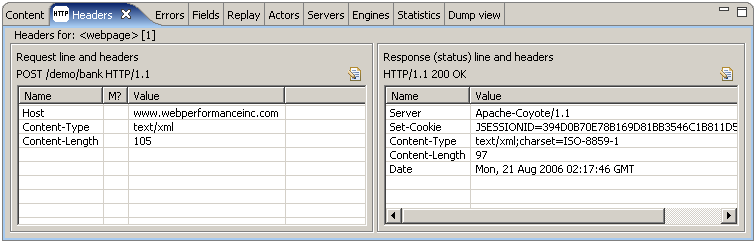
Note that each part of the request headers will need modification as required by your service:
The text file used to create the request shown above contains this:
|
|
|
|
The other request and responses are created in a similar manner.
Once you have the 4 files created (a request and response for each of the 2 transactions), we can create the testcase.
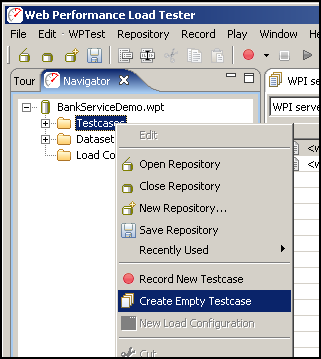
In the Navigator, select the Create Empty Testcase item from the pop-up menu on the Testcases node to create a blank testcase where the transactions can be placed:
We now have an empty testcase (renamed "Check balance"):
![]()
The next step is to create the two transactions required for the Check balance testcase.
Each transaction can be imported (request and response) using the Import->As New Web Page item from the pop-up menu in the testcase editor:
![]()
|
|
|
|
The request and response files are selected in this dialog:
![]()
After importing both transactions, our testcase looks like this:
Step 1 is now complete.
|
|
|
|
Step
 2 - Configuring session-tracking
Before we can execute this testcase in the current form, we have to handle the session-tracking used by the service. We could replay the transactions exactly as we created them, but the service would fail on the second transaction, because the replay would send the session identifier that we put in the transaction. Since this session identifier has probably expired since we obtained it, the get-balance request needs to send the new session-identifier from the login response.
|
|
|
|
Two steps are required to handle session-tracking for this testcase:
To do this, activate the Actors view and select the login transaction in the testcase editor. The Actors view will initially appear as below (empty).
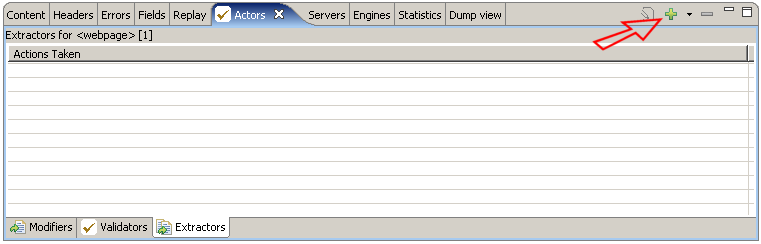
Press the Add
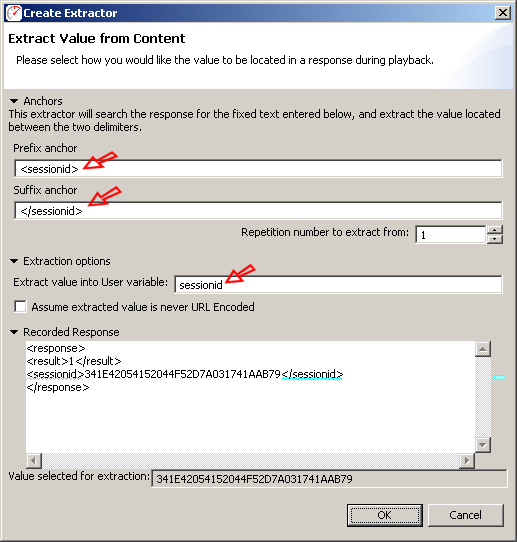
Extractor... button (![]() ) to add a new extractor -
the resulting dialog allows configuration of the extractor. In this case,
we want to extract the session identifier which is located between the
<sessionid> and </sessionid> tags (delimiters) in the response.
As these values are entered in the Prefix
anchor and Suffix anchor
fields, the delimiters will be highlighted in the response content field
in the lower third of the dialog. If either delimiter cannot be located,
an error will be indicated at the top of the dialog. If both the prefix
and suffix anchors are found, the target value for extraction will be
displayed in the field at the bottom. Next we enter sessionid
in the Extract value in user variable
field. This will create a variable in the user state that will contain
the session identifier when it is located by this extractor.
) to add a new extractor -
the resulting dialog allows configuration of the extractor. In this case,
we want to extract the session identifier which is located between the
<sessionid> and </sessionid> tags (delimiters) in the response.
As these values are entered in the Prefix
anchor and Suffix anchor
fields, the delimiters will be highlighted in the response content field
in the lower third of the dialog. If either delimiter cannot be located,
an error will be indicated at the top of the dialog. If both the prefix
and suffix anchors are found, the target value for extraction will be
displayed in the field at the bottom. Next we enter sessionid
in the Extract value in user variable
field. This will create a variable in the user state that will contain
the session identifier when it is located by this extractor.
|
|
|
|
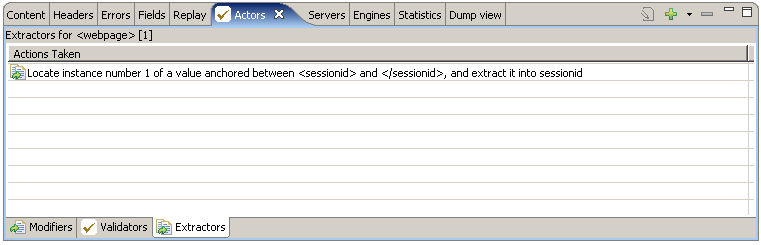
After pressing the OK button, the Actors view will show the Extractor like this:
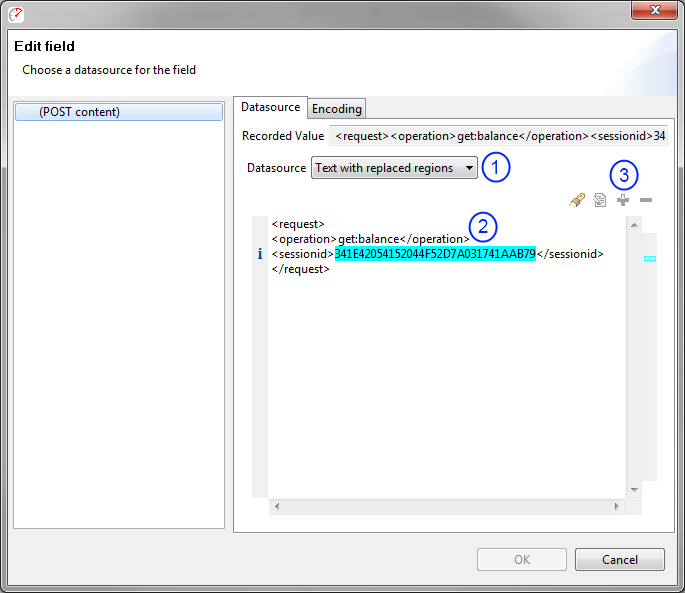
Once the session id has been extracted from the login response, it should be dynamically replaced in the get-balance request. This is accomplished by adding a modifier in the Fields view. Open the Fields view and then select the get-balance transaction in the testcase editor (2nd transaction). The fields in the request will be displayed as below.
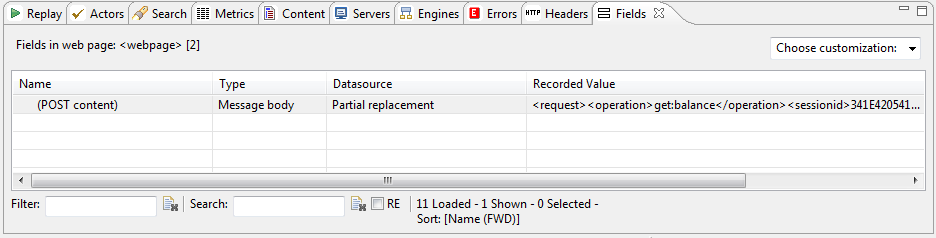
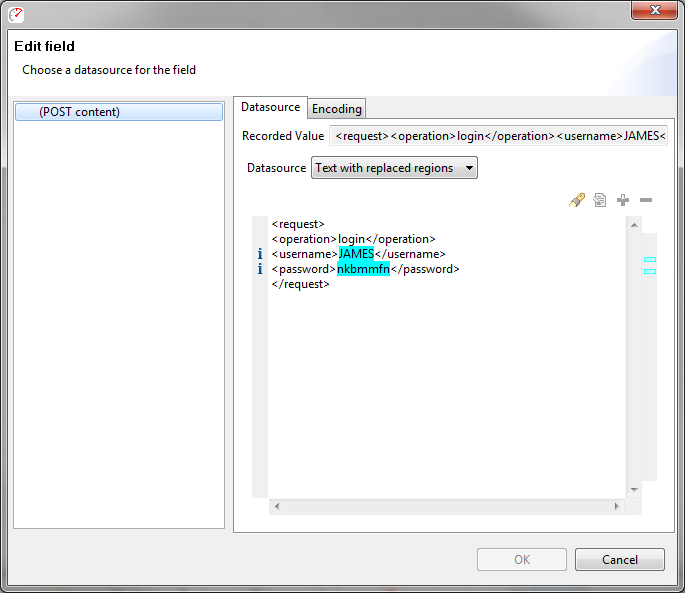
When a POST (message which sends content to the server) is in a format that is not recognized by Load Testers parsers, it will list the field as a (Post content) field. Double-clicking the row will open a dialog
for configuring a datasource on the field. Since we only need to replace a small part of the
request content, select the Text with replaced regions datasource (1). The dialog will now appear as below. Highlight the region to be replaced (2) and then press the Add (![]() ) button (3) to configure a datasource on that region.
) button (3) to configure a datasource on that region.
When all parts of the POST have been configured, press the OK button to save the changes.
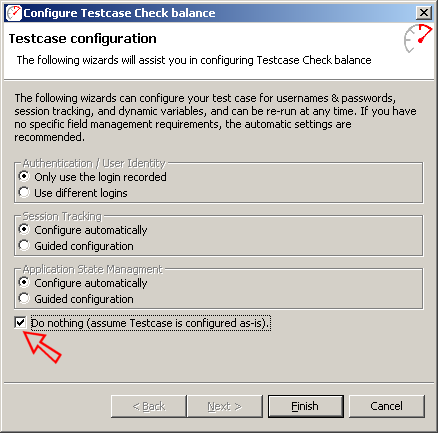
With session-tracking configured
for the testcase, the testcase may be replayed. Pressing the Replay button
(![]() ) in the toolbar
will invoke the testcase configuration wizard. This wizard is very useful
for complicated web applications but for simple web services it is frequently
unnecessary. Select the Do nothing...
option and press the Finish button.
) in the toolbar
will invoke the testcase configuration wizard. This wizard is very useful
for complicated web applications but for simple web services it is frequently
unnecessary. Select the Do nothing...
option and press the Finish button.
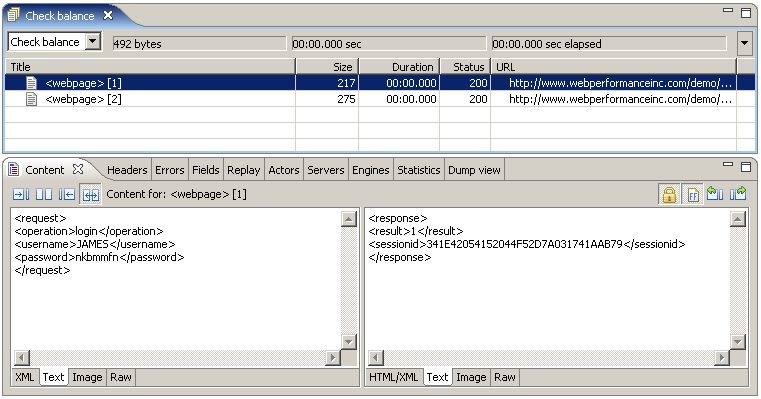
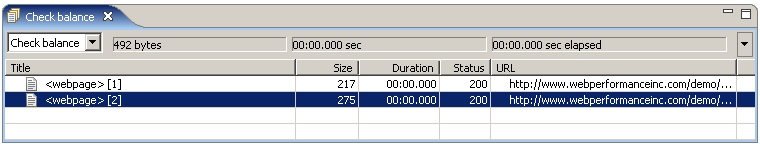
After dismissing the Testcase Configuration wizard, the replay will begin. It will likely end very quickly, since it is a very simple and very short testcase. When it is complete, open the Errors view and then select the testcase to verify that no errors occurred during the replay. Then open the content view and select the get-balance transaction in the testcase editor to view the result:
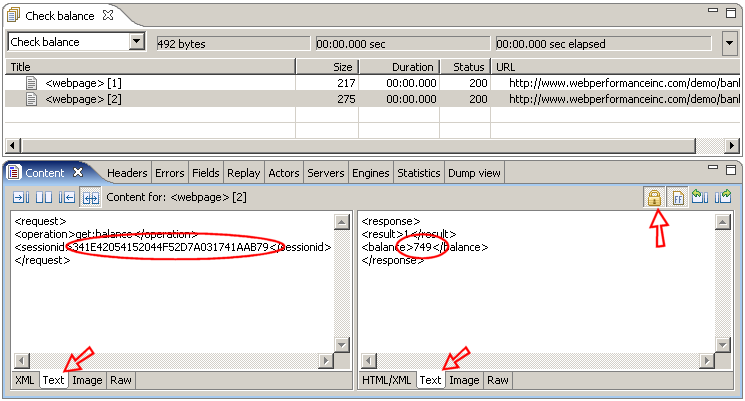
Checking the value of the session identifier we can see that it is different from the original transactions we created - indicating that Analyzer was able to successfully extract the session identifier from the previous response and modify this request to send the correct session identifier. Also note that the balance returned is correct (we'll come back to this later in the tutorial). If you replay this testcase again, you should see a different session identifier with the same balance returned each time.
At this point we can declare success step 2 of this tutorial - we have configured the web service testcase so that it can be successfully replayed.
|
|
|
|
The key difference between the simple replay completed in the last step and a load test is volume. A load test is simply a lot of replays, all happening at the same time. We could perform a load test with the testcase right now, if we wanted. But it would not be a very accurate simulation of the expected use-case of the system since the same person is not likely to be checking their balance simultaneously from multiple locations over and over again. Instead we would like the load tests to simulate many different users checking their balance.
Creating
 test data
The
 first step in simulating multiple users is to create the list of users.
 For this tutorial, we will assume that the system is already populated
 with accounts and we have the list of user names, passwords and current
 account balances available to us.
|
|
|
|
The next step is to import this data into Analyzer™. This is done from the Dataset node in the Navigator. Select the Import... item from the pop-up menu and complete the import dialog:
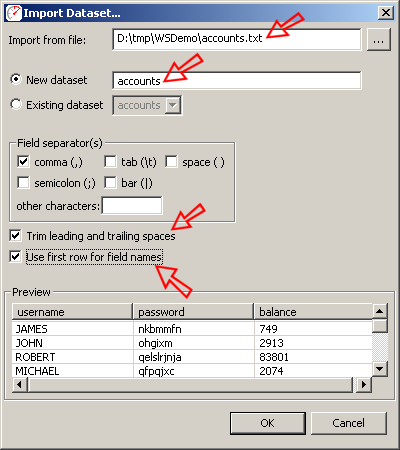
After importing the dataset, it will appear in the Navigator under the Datasets tree node and the dataset will open to show the imported data:
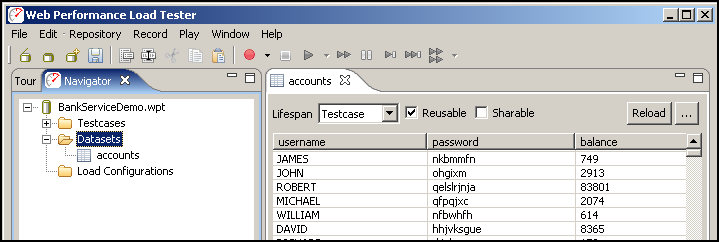
Note the 3 settings at the top of the dataset editor: Lifespan, Resuable & Sharable. The Testcase lifespan indicates that when a Virtual User (VU, or simulated user) selects a row of data from this data, it will use that row until the end of the testcase. When a dataset resuable, the row may be used more than once during a load test. When a dataset is not sharable, it can only be used by single VU at a time. The default settings, shown above, are usually correct for a dataset containing the user identity.
Customizing
 the testcase
Now that the user identity information is available, the testcase may be customized to use it. Two modifiers should be added to the first transaction to replace the username and password in the login request with values from the dataset. This configuration is similar to the configuration of the session-identifier described earlier in this tutorial:
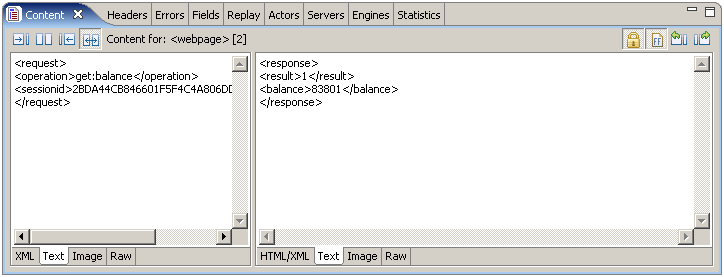
The testcase is now configured to use a different user identity each time the testcase runs. Replaying the testcase, as described earlier, will allow you to easily verify this behavior. Each time the testcase is replayed, a different username and password are sent in the requests and a different account balance is returned. The following shows the get-balance transaction from the 3rd replay. You can see that the balance, 83801 matches the balance for that user in the dataset.
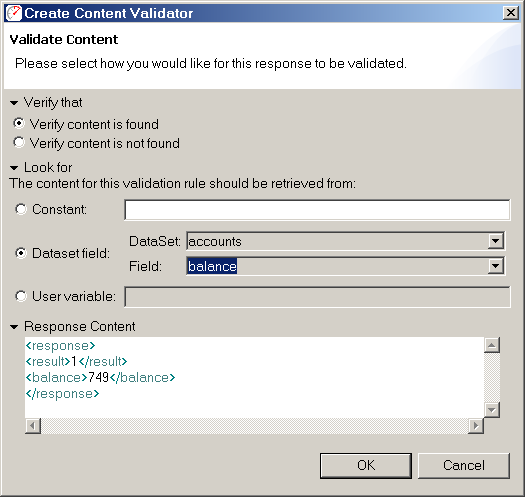
Validating the results in this way is easy for a few replays, but is not practical for a load test. It would be more efficient to have Analyzer automatically validate the balance returned in each testcase against the value in the dataset.
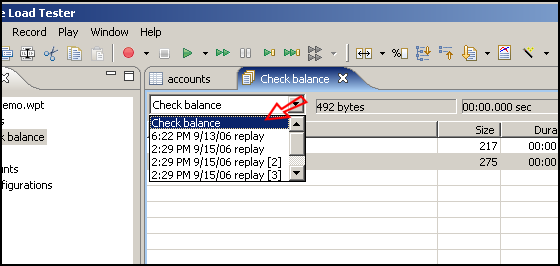
To configure a validator, first return to the original testcase in the editor:
Next, open the Actors view and then select
the get-balance transaction in the testcase editor. Then select the Validators tab at the bottom of the
Actors view. You will see the automatically-applied status-code validator
already present in the list of validators. Press the add button (![]() ) to add a new validator.
) to add a new validator.
Configure the validator to look for the account balance from the dataset in the response content by selecting the Dataset field and radio button and then select the balance field in the accounts dataset, as shown below:
After applying the validator, replay the testcase again and check the Errors tab to verify that no errors were encountered. There should be no errors because our dataset accurately reflects the system being tested.
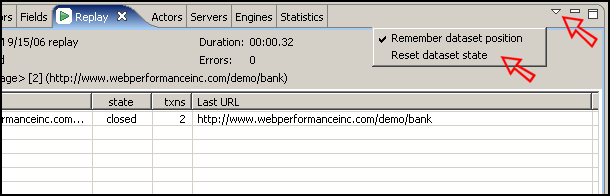
To see what the error looks like from the validator, the dataset will have to be changed to purposely have wrong data in it. Open the accounts dataset and change the value of the first entry in the balance column (double-click a cell to edit it). Before replaying, we will need the force the replay mechanism to reload the dataset - to do this, open the Replay view and select the Reset Dataset State item from the drop-down menu on the right side of the view:
Replay the testcase again and then open the Errors view. The validation error displayed indicates that the account balance that I entered in the dataset (749X) could not be found in the response content for the get-balance transaction:
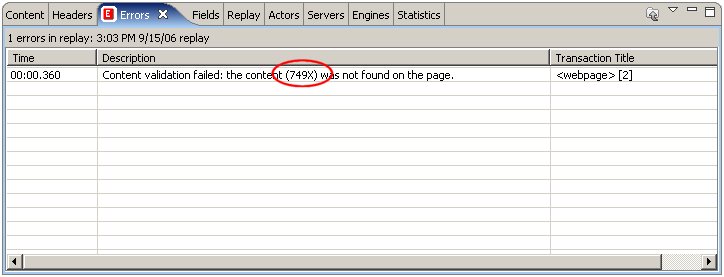
Don't forget to change the dataset value back to the correct value before moving on!
Step 3 is now complete - we can move on to running a load test.
Creating
 the load configuration
After recording, configuring and
verifying each testcase, the next step towards a load test is to create
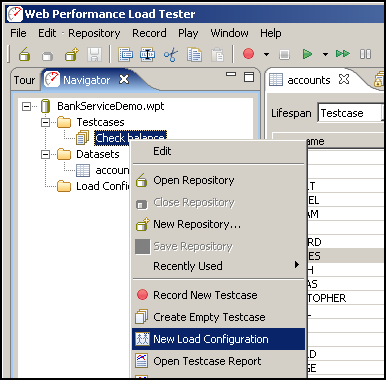
a load configuration. Select the Check
Balance testcase
in the Navigator and then select the Create
Load Configuration
item from the pop-up menu:
The default settings, shown below, should be fine for demonstration purposes.
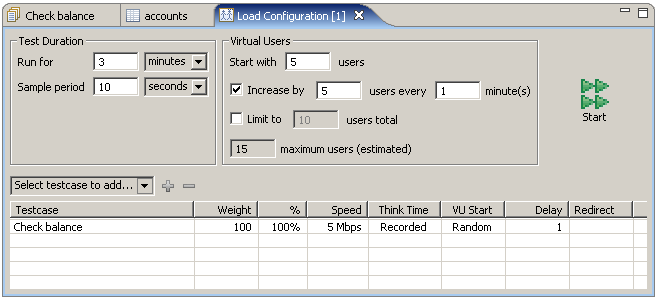
Running
 the load test
At this point, the hard work is done! Push the start button to start the load test.
The test will add 5 VUs each minute - if you are using a demo license, it will stop at 10 VUs for the last minute of the test. When the test is complete, the results screen will look something like this:
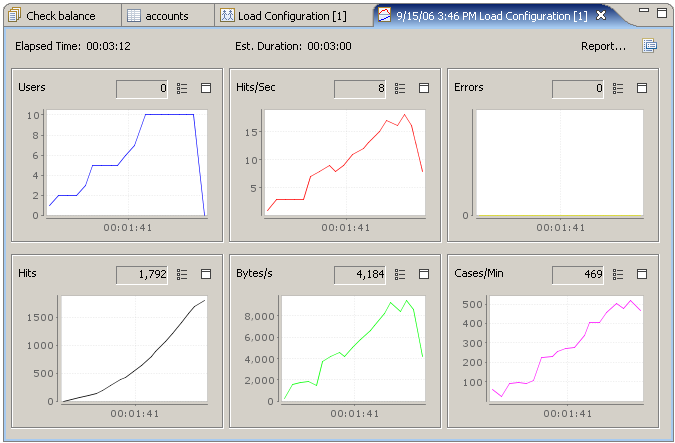
Analyzing
 the Results
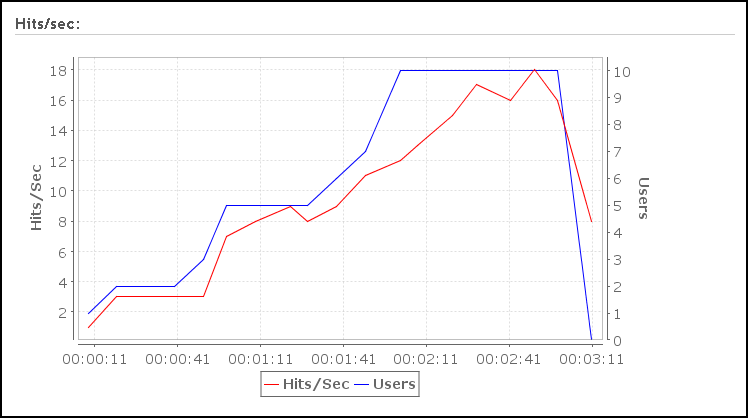
The test results screen picture above, provides some basic metrics for monitoring the progress and state of the test - most notably the number of Users, Hits/Sec and Errors. For a more detailed analysis open the test report: press the Report... button on the results screen. In the first section of the report, you will see overall metrics presented on charts such as the one pictured below. This chart shows that the total Hits/sec scaled linearly as the number of users increased. This is a key measure of server performance and this test did very well!
A large amount of information is available in the test report at varying levels of detail. For a good example of a load test report, see the website: http://www.webperformanceinc.com/load_testing/reports/
In this tutorial we have demonstrated the basic process for testing a web service:
Good luck!