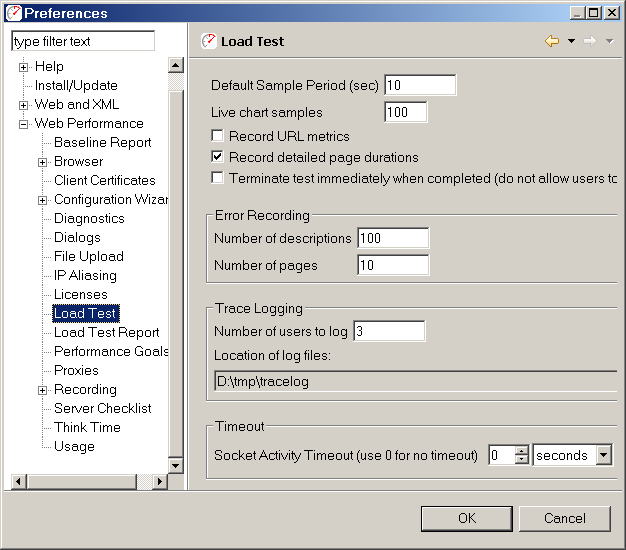
The Load Test Settings page is located in the Web Performance section of the Preferences dialog (Window->Preferences menu item). The following pictures shows the default settings.

Specifies a default value for the frequency at which data metrics snapshots are recorded, in seconds. The default value will be used when a new load test configuration is created.
Specifies the number of points to plot in each chart while a test is under way. Increasing this value will allow each chart to show data for a greater length of time, but may increase the amount CPU load required by each chart as it is animated. This setting has no effect when reviewing data from a previous test.
This setting determines whether or not the load test will collect metrics for each URL in your testcase. Disabling this value will greatly reduce the amount of data collected by the load test, while enabling it will provide more detailed information about each individual component within a web page. Page and test level data are always recorded.
This setting determines whether or not the load test will record the duration of every page during the load test. Disabling this value will greatly reduce the amount of data collected by the load test, while enabling it will provide more detailed information about the performance of the pages.
Causes the load test to terminate when the allotted time for the test has finished. Normally, the test will give each virtual user a chance to complete their testcase, logging them off from the test site (if applicable). Enabling this option will cause all virtual users to cease running regardless of how far along they are in the page. Note that an active test may be halted in a similar fashion by pressing the red stop button in the Status View.
This setting limits the number of error description strings that are recorded during a load test (per testcase). Entering a large number may provide more information about errors when needed and it may also increase memory usage significantly.
When an error is encountered during a load test, the web page which triggered the error is saved. This setting limits the number of times an error page will be recorded during a load test (per testcase).
Detailed messaging between one or more virtual users and the servers in a load test can be saved for debugging purposes. To enable trace logging, select the Enable option. The number of users to save and the location of the log files can be specified once the option is enabled.
A VU Trace Log is a detailed log of all the transactions performed by a virtual user. Trace logging is enabled from the Play menu. Please note that this feature will consume a large amount of disk space very quickly and has a significant effect on the performance of the product. As a result the feature will be reset (deactivated) each time Load Tester is restarted, to prevent accidental use during normal testing.
Trace logs provide detailed information about the activity of virtual users that is not needed for most load-testing tasks. It is provided only for troubleshooting and diagnostics. As such it is considered a "rough" feature that does not have a convenient graphical user interface. A text editor (e.g. notepad) must be used to view the log files.
The trace logs will be generated for the first 5 virtual users that run in the test. The resulting logs are stored in the tracelog folder under the Web Performance TrainerTM installation folder. The logs are stored in the following folder structure:
T0...Tn: For each test run, a new folder will be created under the tracelog folder.
BC0...BCn: For each Business Case in the test, a corresponding folder will be created under the test folder.
VU0...VUn: For each virtual user running the Business Case, a corresponding folder will be created under the Business Case folder.
R0...Rn: For each repeat of the Business Case that the virtual user performs, a corresponding folder will be created under the virtual user folder.
Within each repeat folder (R0...Rn), a log of the user activities will be contained in a file called log.txt. An example of this file is shown here:
00:01.248 BCS: started testcase, BC=Case1
00:01.248 WPS: started page #0, PAGE=http://dell2:81/
00:01.249 CNI: initiated connection to: dell2:81
connection# = 20102672
00:01.251 CNO: connection opened to: dell2:81
connection# = 20102672
00:01.251 TQS: started request for: /
connection# = 20102672
00:01.253 TQE: completed request for: /
connection# = 20102672
00:01.257 TSS: started response for: /
connection# = 20102672
00:01.265 TSE: completed response for: /
connection# = 20102672
HTTP/1.1 200 OK
00:01.266 CNI: initiated connection to: dell2:81
connection# = 17099451
00:01.267 TQS: started request for: /tomcat.gif
connection# = 20102672
00:01.268 TQE: completed request for: /tomcat.gif
connection# = 20102672
00:01.269 CNO: connection opened to: dell2:81
connection# = 17099451
00:01.269 TQS: started request for: /jakarta-banner.gif
connection# = 17099451
00:01.281 TQE: completed request for: /jakarta-banner.gif
connection# = 17099451
00:01.282 TSS: started response for: /tomcat.gif
connection# = 20102672
00:01.286 TSE: completed response for: /tomcat.gif
connection# = 20102672
HTTP/1.1 200 OK
00:01.314 WPE: completed page #0, PAGE=http://dell2:81/
00:01.314 CNC: closed connection to: dell2:81
connection# = 20102672
00:01.314 CNC: closed connection to: dell2:81
connection# = 17099451
00:01.314 BCE: completed testcase, BC=Case1
Additionally, the full contents
of each transaction (both request and response) are saved in files called
T0.txt...Tn.txt.
These files contain the full request and response, including the start-line,
headers and content. If any parts of the request are modified from the
original before sending to the server (e.g. data replacement), the file
will reflect these changes exactly as they were sent to the server. For
SSL transactions, the content will reflect the unencrypted content.