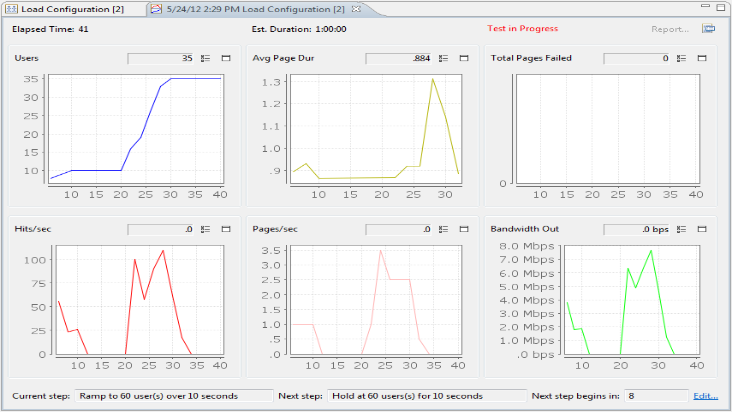
This view is activated when a load test is started to allow monitoring of the progress of the test while it is running. After the test is completed, the same view provides a summary of the most frequently used test parameters.

Elapsed time
While a test is running, this indicates the time elapsed since the test was started. If the test has completed, it indicates the total duration of the test.
This indicates the estimated duration of the test, based on the test configuration.
Report...
Opens the Load Test Report.
The remainder of the view displays numerical and graphical displays of 6 key performance metrics. During a test, these metrics will be updated periodically. After a test has completed, the charts will show the results for the entire test while the numbers will reflect the last sample collected.
![]() Display Properties
Display Properties
Opens the properties editor for configuring the display preferences. Use this to change the number of charts displayed in the display.
![]() Chart Properties
Chart Properties
Opens the properties editor for configuring the chart preferences. Use this to change the data displayed in the chart.
![]() Chart Maximize
Chart Maximize
Maximize the selected chart.
Only visible when a test is in progress, this field describes the current step -- typically either ramping in new users or holding at a steady state for analysis.
Indicates the next step of the test plan. If the pause button has been selected, or the test plan has been edited, those selections will be indicated here. Otherwise, this field will describe the next action in the currently running test plan.
This field displays the time until the current step ends and the next step begins.
Edit
In most cases, you can edit the currently running test plan. In Load Tester 5.1, it is not possible to remove users who are already running.